
emissions
Cattle alone accounts for 14.5% of annual global greenhouse gas emissions. [208]


While beef consumption in the United States has been trending downwards and American beef exports have been increasing, this has not lead to a reduction in overseas deforestation as previously expected. This is because Brazilian beef is exported for a different market than American beef, which is intended for higher-income consumers in rich countries. Brazilian beef, which is grass versus grain-fed, is exported to low-income consumers. Demand for this leaner Brazilian beef is expanding rapidly. [209]

Regional emissions and production profiles vary widely. Differences are explained by the respective shares of ruminants or monogastrics in total livestock production, and by differences in emission intensities for each product, between regions. Latin America and the Caribbean have the highest level of emissions (almost 1.3 gigatonnes CO2 - eq), driven by an important production of specialized beef. Although at reduced pace in recent years, ongoing land-use change contributes to high CO2 emissions in the region, due to the expansion of both pasture and cropland for feed production. With the highest livestock production and relatively high emission intensities for its beef and pork, East Asia has the second highest level of emissions (more than 1 gigatonnes CO2 -eq). North America and Western Europe have similar GHG emission totals (over 0.6 gigatonnes CO2 -eq) and also fairly similar levels of protein output. However, emission patterns are different. In North America, almost two-thirds of emissions originate from beef production which has high emission intensities. In contrast, beef in Western Europe mainly comes from dairy herds with much lower emission intensities (Section 4). In North America, emission intensities for chicken, pork and milk are lower than in Western Europe because the region generally relies on feed with lower emission intensity. South Asia’s total sector emissions are at the same level as North America and Western Europe but its protein production is half what is produced in those areas. Ruminants contribute a large share due to their high emission intensity. For the same reason, emissions in sub-Saharan Africa are large, despite a low protein output. [208]

Consumption of meat and fish in Asia is expected to expand 73% to 233 million tonnes by 2050. [210]
Feed production and processing account for 45% of livestock emissions, whereas 39% of emissions come from enteric fermentation (intestinal gases). [211]

-
Food accounts for 10-30% of a household’s carbon footprint, typically a higher portion in lower-income households. [214] Production accounts for 68% of food emissions, while transportation accounts for 5%. [215]
-
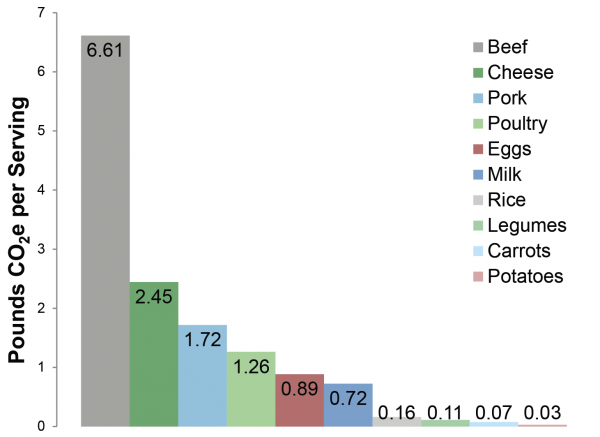
Meat products have larger carbon footprints per calorie than grain or vegetable products because of the inefficient transformation of plant energy to animal energy, and due to the methane released from manure management and enteric fermentation in ruminants. [216]
-
Ruminants such as cattle, sheep, and goats produced 178 million metric tons (mmt) CO2e of enteric methane in the U.S. in 2018. [217]
-
Eliminating the transport of food for one year could save the GHG equivalent of driving 1,000 miles, while shifting to a vegetarian meal one day a week could save the equivalent of driving 1,160 miles. [216]
